(Unofficial) Record-breaking temperature across the Globe
Feel free to read the interesting history of these web pages: http://coolwx.com/history.php
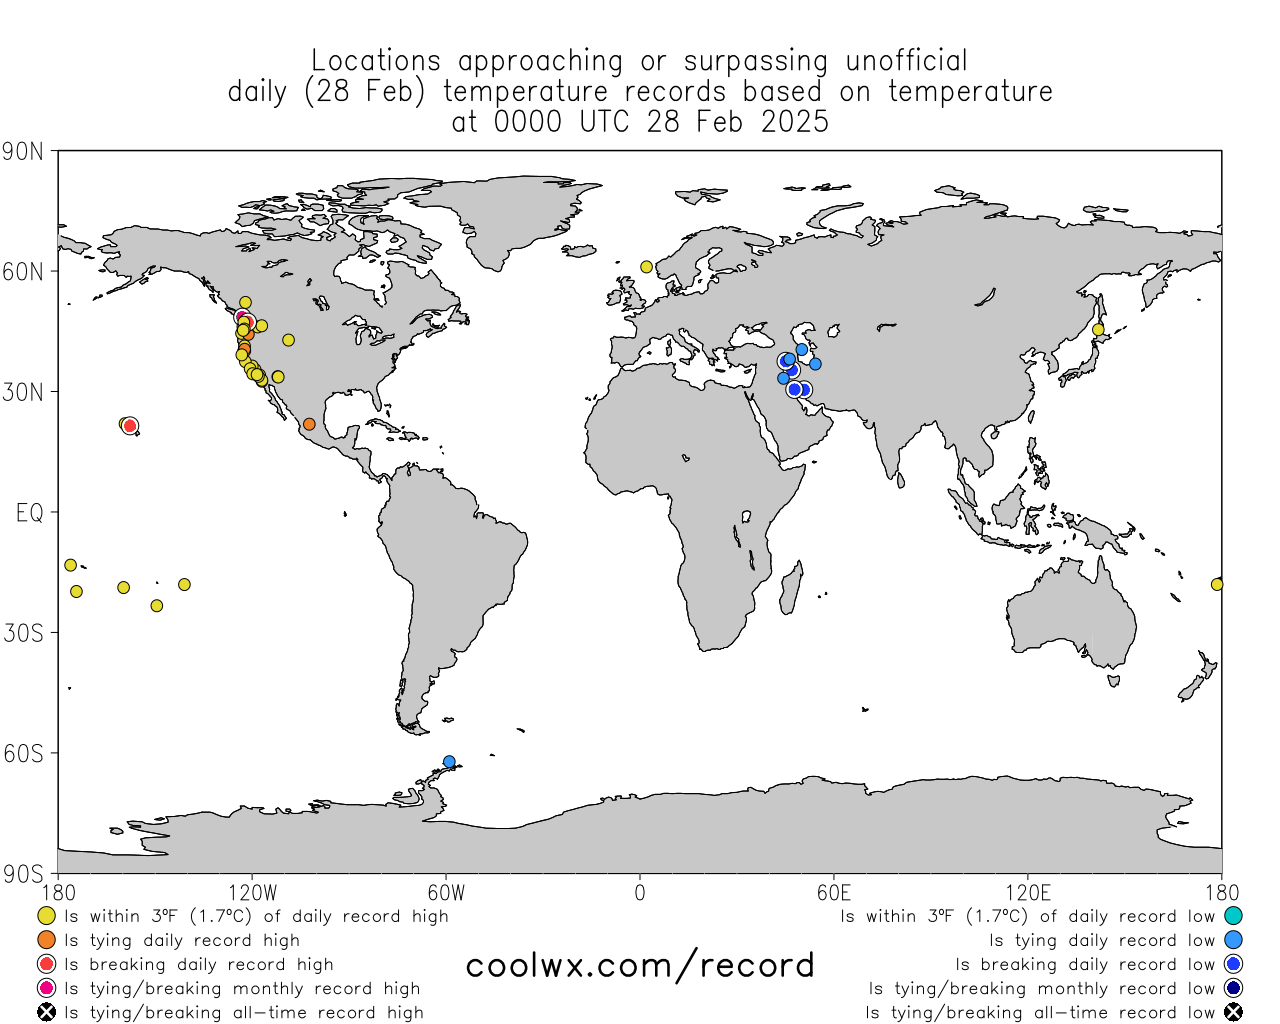
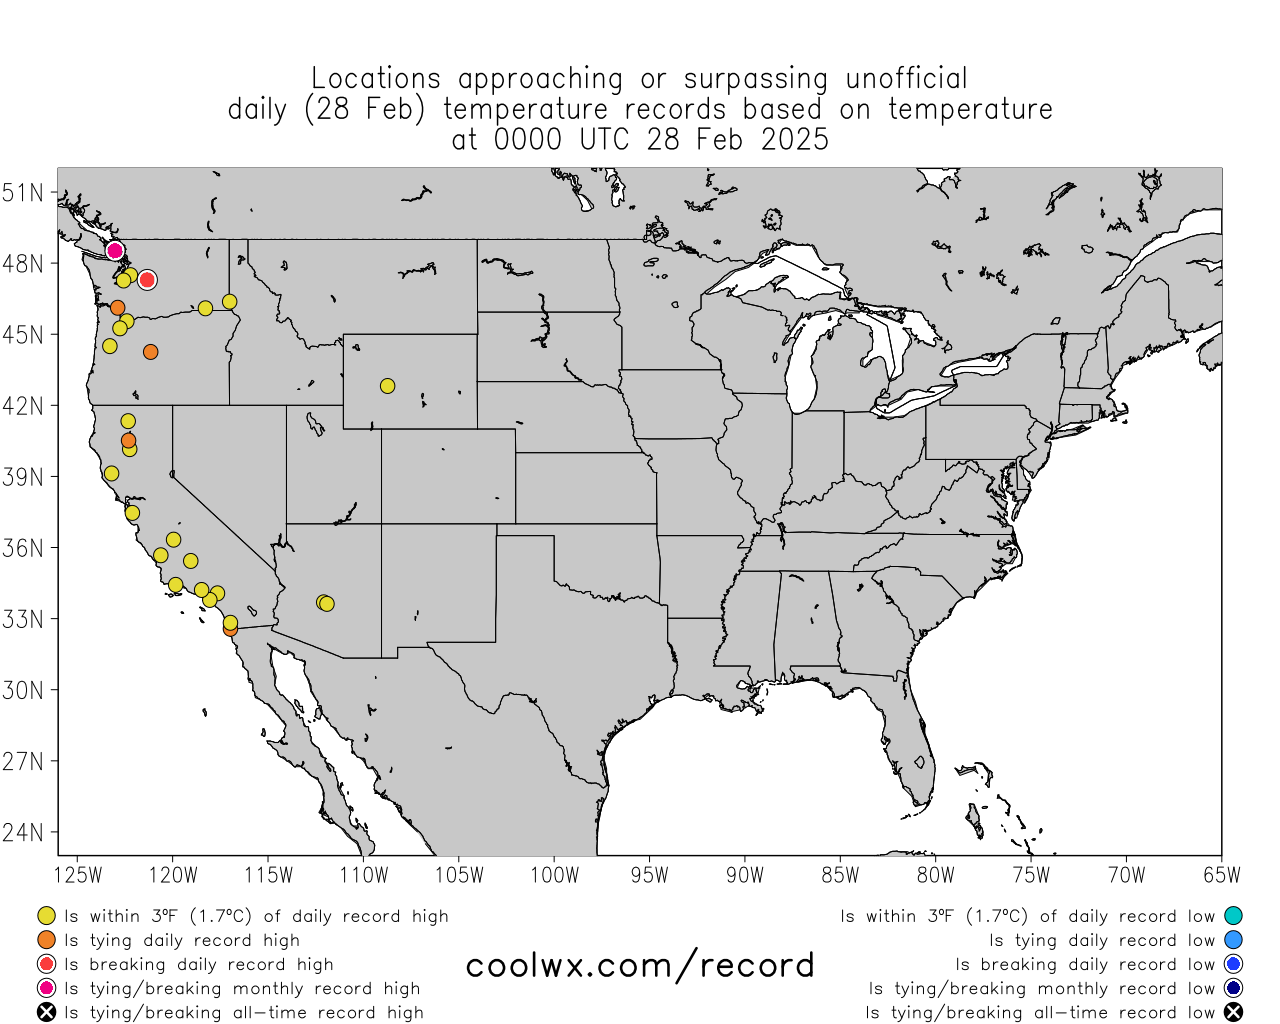
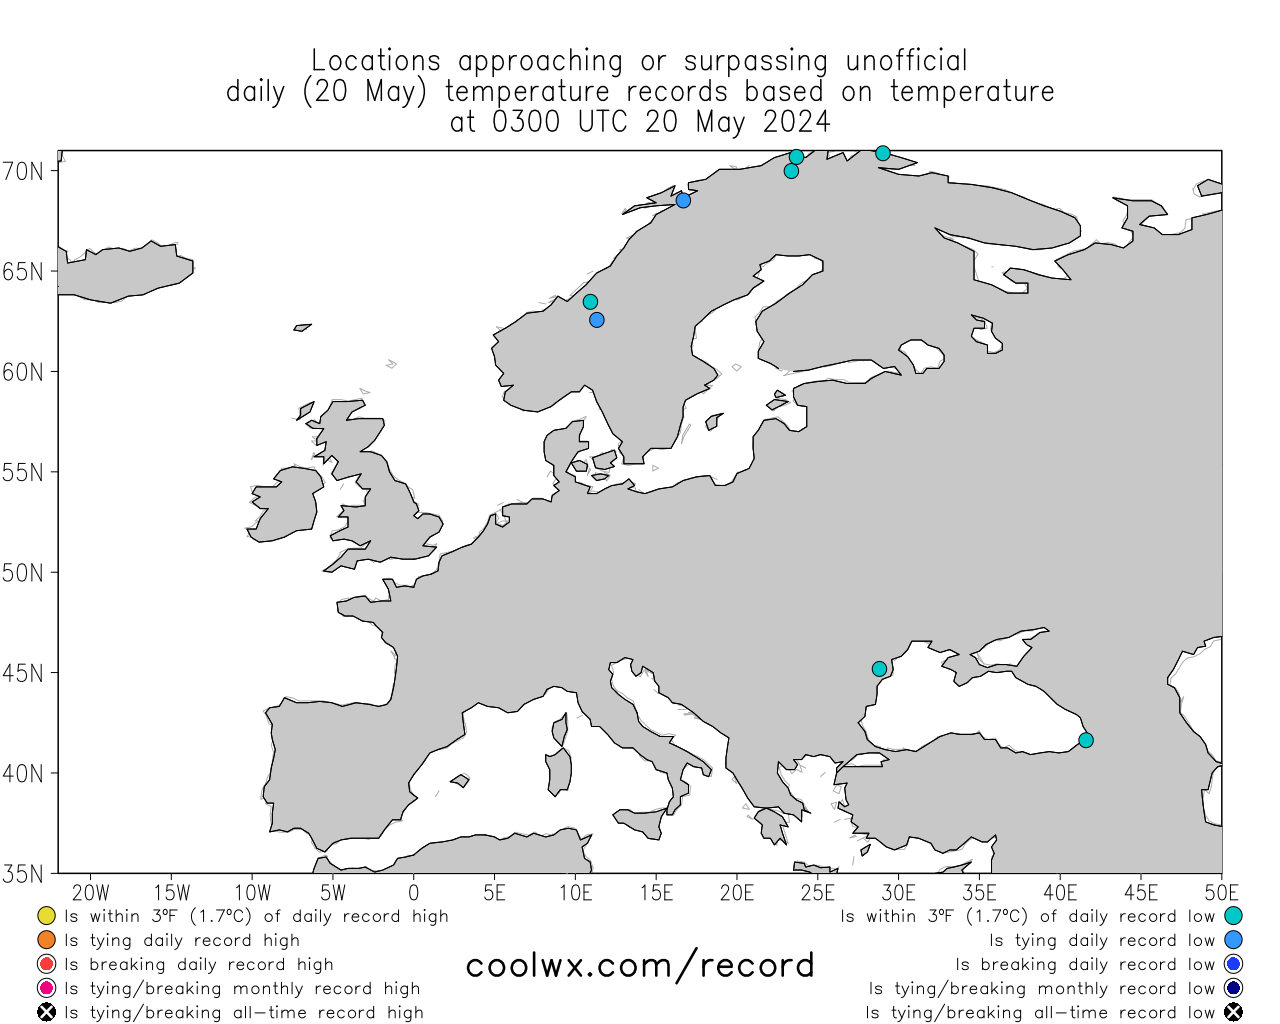
This page displays global cities that are currently approaching, matching, or exceeding
unofficial daily/monthly/all-time record temperatures.
Please read the important notes at the very bottom of this page before using this data.
Move the mouse over a colored dot on the images to view the information on the temperature record.
** Note: As of 19 February 2024, the almanac has been updated to include all of 2023's data. **
Last updated at Sat May 11 00:32:44 UTC 2024 using 2401 observations from 00UTC
Unofficially, there are currently 9 stations that have broken their daily high record, 11 that are tying it, and 28 that are near it.
Unofficially, there is currently 1 station that has broken their daily low record, 0 that are tying it, and 3 that are near it.
| . | Tied/Broken |
Tied/Broken |
|||
| HIGH RECORD |
|||||
| LOW RECORD |
| . | Tied/Broken |
Tied/Broken |
|||
| HIGH RECORD |
|||||
| LOW RECORD |
Table Units: [ Fahrenheit | Celsius ]
| City | Country | Temp & Trend (°F) | Monthly / Alltime Record (°F) | Unofficial Daily Record (°F) | Length (years) | ||
| Crescent City, CA | United States | (1978) (2013) (2020) | |||||
| Newport, OR | United States | (2016) (2008) (1991) | |||||
| Brookings, OR | United States | (2021) (2008) (2008) | |||||
| Portland, OR | United States | (2019) (1983) (2021) | |||||
| Friday Harbor, WA | United States | (2019) (2023) (2021) | |||||
| Princeton Airport | Canada | (2019) (1983) (2021) | |||||
| Kelso-Longview, WA | United States | (2020) (2008) (2021) | |||||
| Portland, OR | United States | (2019) (1983) (2021) | |||||
| Rocky House | Canada | (2013) (1986) (1983) | |||||
| Salt Point, LA | United States | (2014) (1989) (1995) | |||||
| Port Angeles, WA | United States | (2019) (1983) (2021) | |||||
| Buffalo Narrows Man | Canada | (1993) (1999) (1991) | |||||
| Campbell River Airport | Canada | (2020) (2023) (2021) | |||||
| Sparwood / Elk Valley | Canada | (2019) (1986) (2018) | |||||
| Lytton, B. C. | Canada | (2019) (1983) (2021) | |||||
| Kosrae Island, Kosrae Airport | Micronesia | (1997) (2009) (1999) | |||||
| Kekaha, HI | United States | (1945) (2017) (2017) | |||||
| North Bend, OR | United States | (2016) (2023) (2022) | |||||
| Prince George, B. C. | Canada | (2015) (1983) (2021) | |||||
| Eugene, OR | United States | (2019) (2008) (2021) | |||||
| Tacoma, WA | United States | (2020) (2023) (2021) | |||||
| Olympia, WA | United States | (2020) (1983) (2021) | |||||
| Bremerton National, WA | United States | (1997) (1983) (2021) | |||||
| Aurora, OR | United States | (1997) (2006) (2021) | |||||
| Asuncion / Aeropuerto | Paraguay | (2020) (2020) (1982) | |||||
| Penticton, B. C. | Canada | (2019) (1986) (2021) | |||||
| Grande Prairie, Alta. | Canada | (1993) (1985) (2021) | |||||
| Peace River, Alta. | Canada | (2019) (1999) (2021) | |||||
| Agassiz | Canada | (2019) (2023) (2021) | |||||
| Christmas / Cassidy | New Zealand | (2022) (2021) (1982) | |||||
| Fort Lewis, WA | United States | (2020) (1983) (2021) | |||||
| Nanaimo Airport | Canada | (2019) (1983) (2021) | |||||
| Saipan Island, Saipan Intl Arpt | United States | (2021) (1993) (1986) | |||||
| Roseburg, OR | United States | (2019) (2008) (2021) | |||||
| Quillayute, WA | United States | (2020) (2023) (2021) | |||||
| Tacoma / McChord AFB, WA | United States | (2020) (1983) (2021) | |||||
| Shelton, WA | United States | (2019) (2005) (2021) | |||||
| Buffalo Narrows, Sask. | Canada | (1991) (1995) (2021) | |||||
| Houston, TX | United States | (2003) (1993) (2023) | |||||
| Portland, OR | United States | (1997) (1983) (2021) | |||||
| Banff | Canada | (2013) (2006) (2021) | |||||
| Tumbes | Peru | (1998) (1988) (2020) | |||||
| Andersen, GU | United States | (2018) (1993) (2016) | |||||
| Key West, FL | United States | (2019) (2022) (2017) | |||||
| New Orleans, LA | United States | (2003) (2018) (1976) | |||||
| . | |||||||
| Nan | Thailand | (1999) (1981) (1975) | |||||
| Mattala Rajapaks | Sri Lanka | (1974) (1979) (1973) | |||||
| Aktjubinsk | Kazakhstan | (1971) (1969) (2002) | |||||
| Gach Saran Du Gunbadan | Iran | (2018) (2023) (1973) | |||||
| City | Country | Temp & Trend (°F) | Monthly / Alltime Record (°F) | Unofficial Daily Record (°F) | Length (years) | ||
Table Units: [ Fahrenheit | Celsius ]
| . | Tied/Broken |
Tied/Broken |
|||
| HIGH RECORD |
|||||
| LOW RECORD |
- The source of the historical data here is the NCDC GSOD (updated through 2023 as of 19 February 2024).
- The records are defined here using GMT, with the day resetting at 00GMT (7PM EST;8PM EDT).
- These records are NOT official and differ from official records that use a longer database and local (not GMT) time.
- Only cities having an NCDC GSOD recorded history of at least 35 years are shown here.
- With the additional year of data available (2023), 51 new stations (for a total of 3740) now meet the 35 year minimum record.
- In cases when there are multiple years of records for a city, the latest (most recent) year is shown above.
- Note that given the relatively short record used here (as small as 35 years), records will almost assuredly be set somewhere every day for the next several decades to centuries.
- Appreciation to R. Maue, E. Blake, and R. Remondelli, among several others, for feedback.