(Unofficial) Record-breaking temperature across the Globe
Feel free to read the interesting history of these web pages: http://coolwx.com/history.php
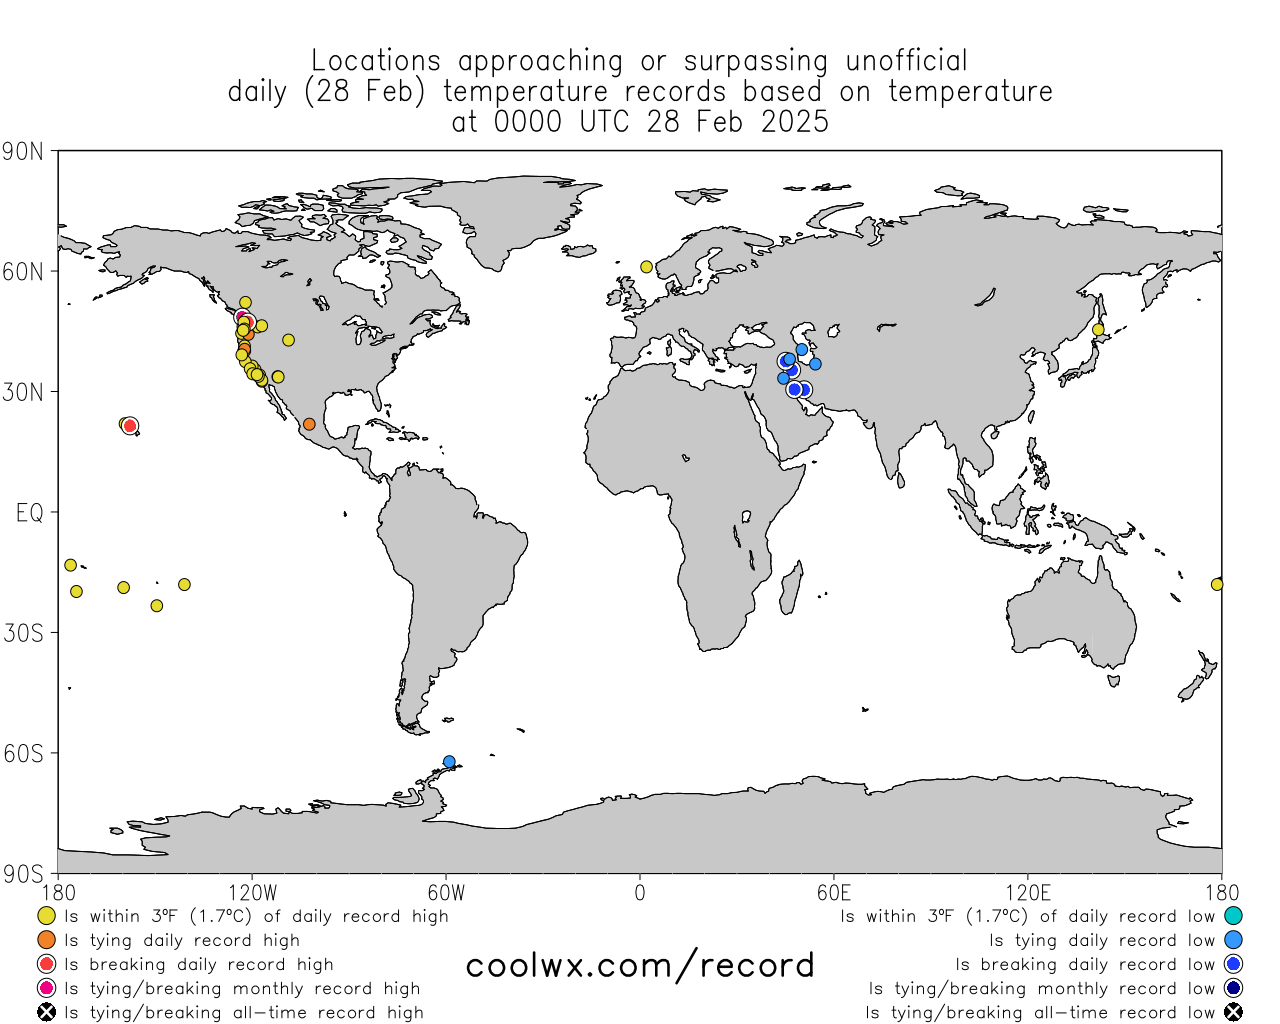
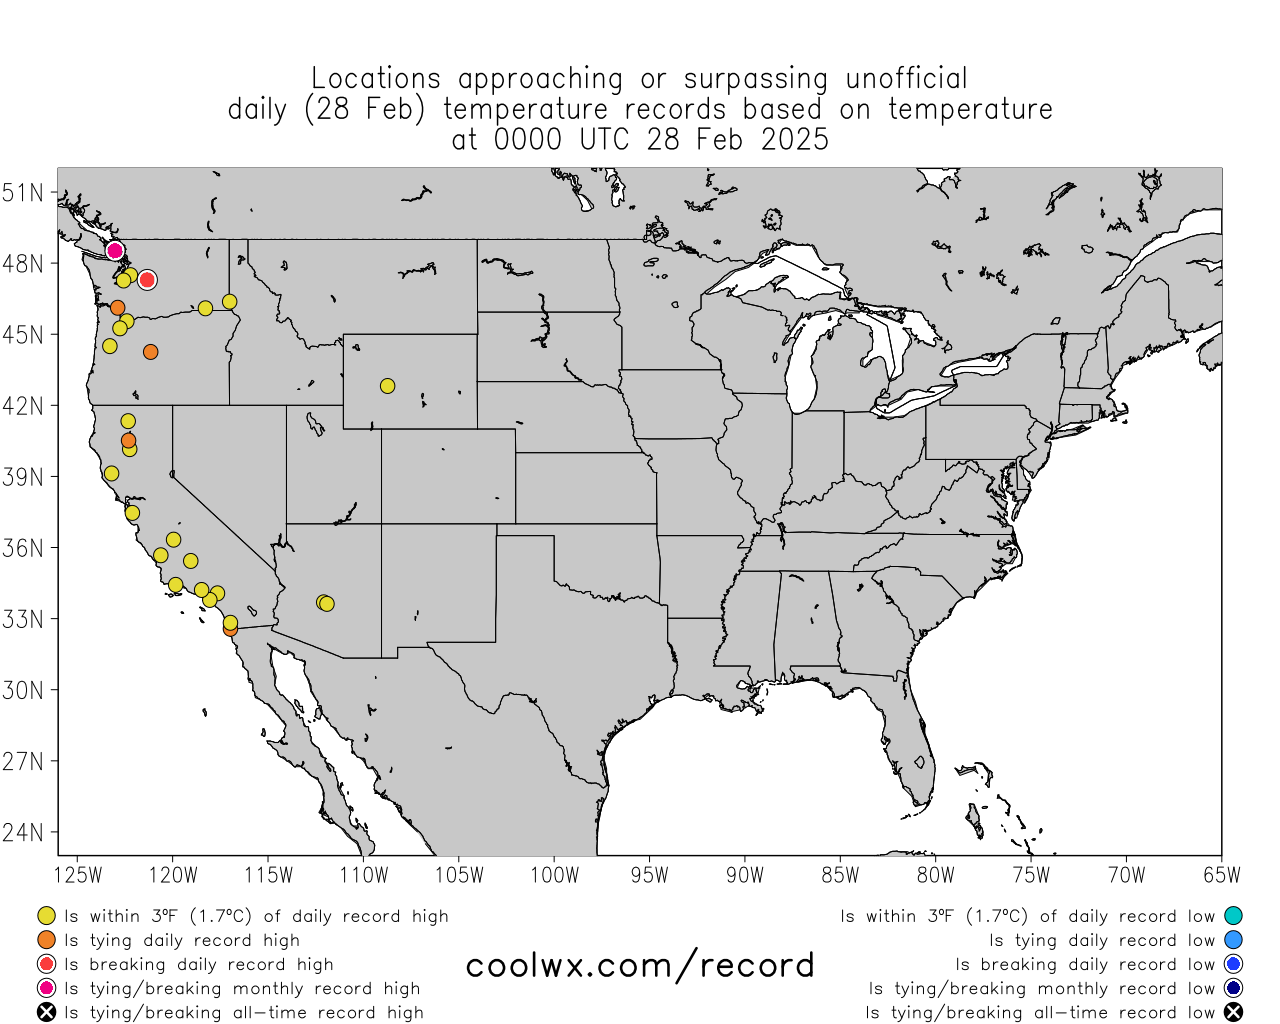
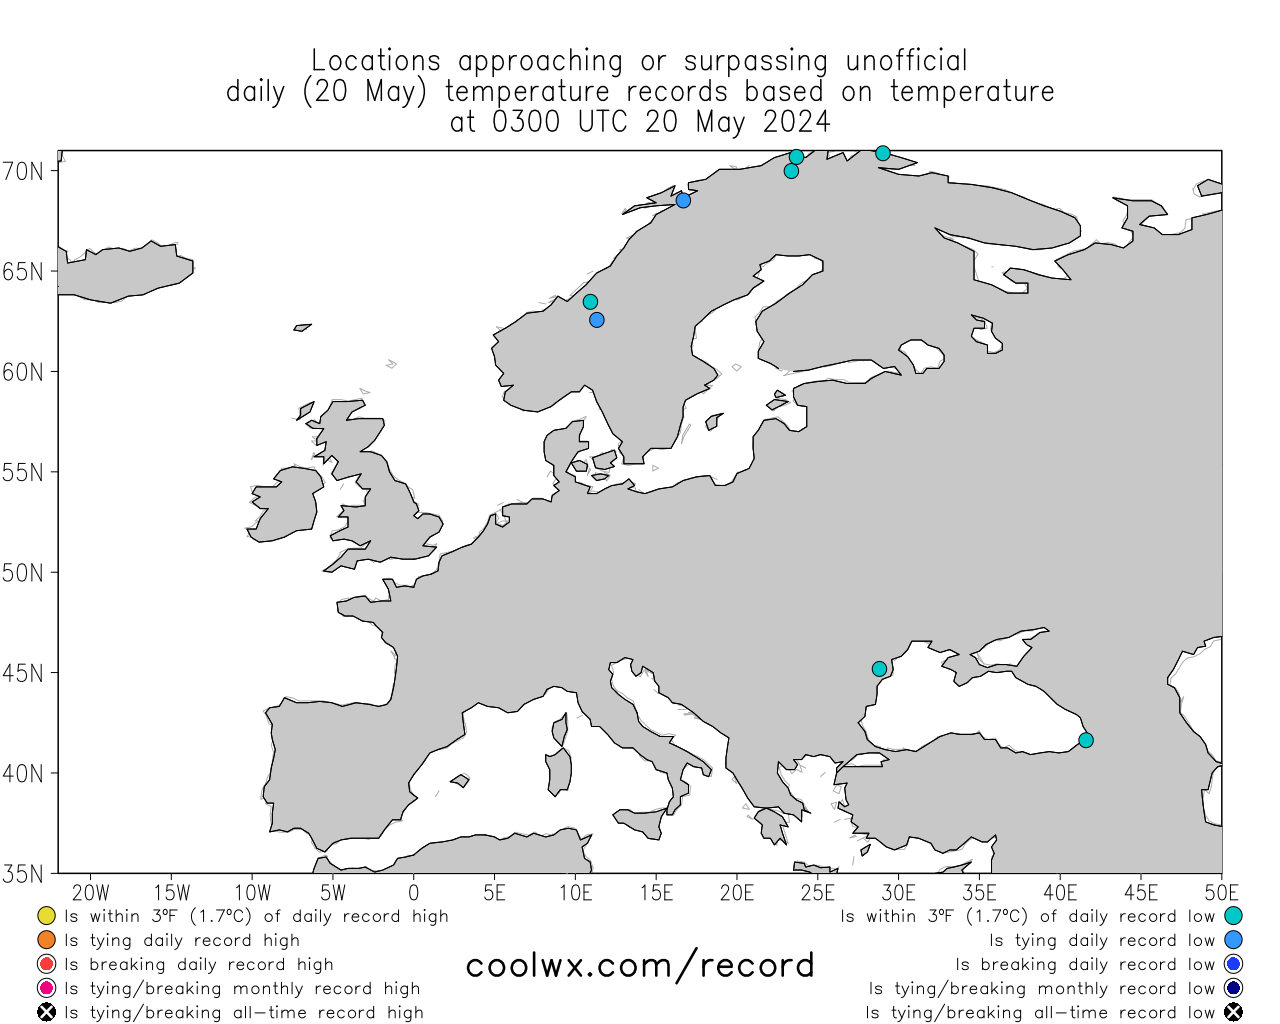
This page displays global cities that are currently approaching, matching, or exceeding
unofficial daily/monthly/all-time record temperatures.
Please read the important notes at the very bottom of this page before using this data.
Move the mouse over a colored dot on the images to view the information on the temperature record.
** Note: As of 19 February 2024, the almanac has been updated to include all of 2023's data. **
Last updated at Mon Aug 3 14:32:48 UTC 2026 using 2586 observations from 14UTC
Unofficially, there are currently 54 stations that have broken their daily high record, 36 that are tying it, and 70 that are near it.
Unofficially, there are currently 0 stations that have broken their daily low record, 1 that is tying it, and 7 that are near it.
| . | Tied/Broken |
Tied/Broken |
|||
| HIGH RECORD |
|||||
| LOW RECORD |
| . | Tied/Broken |
Tied/Broken |
|||
| HIGH RECORD |
|||||
| LOW RECORD |
Table Units: [ Fahrenheit | Celsius ]
| City | Country | Temp & Trend (°C) | Monthly / Alltime Record (°C) | Unofficial Daily Record (°C) | Length (years) | ||
| Fairford Royal AFB | United Kingdom | (1995) (2020) (2022) | |||||
| Las Palmas De Gran Canaria / Gando | Spain | (2000) (2010) (2010) | |||||
| Schwaebisch Hall | Germany | (2022) (2015) (2015) | |||||
| Piacenza | Italy | (2017) (2003) (2003) | |||||
| Buechel | Germany | (2018) (2003) (2003) | |||||
| Hahn | Germany | (2022) (2003) (2003) | |||||
| Aviano | Italy | (2017) (1979) (1979) | |||||
| Munchen | Germany | (1992) (2003) (2003) | |||||
| Memmingen Allgau | Germany | (1943) (2015) (1984) | |||||
| Kecskemet | Hungary | (2017) (2008) (2007) | |||||
| Soroti | Uganda | (2017) (2017) (2002) | |||||
| Debrecen | Hungary | (2017) (1952) (1952) | |||||
| Lanzarote / Aeropuerto | Spain | (2024) (1980) (1980) | |||||
| Hohenfels | Germany | (2018) (2012) (1983) | |||||
| Baia Mare | Romania | (2017) (2012) (2012) | |||||
| Augsburg | Germany | (1963) (2003) (1983) | |||||
| Lechfeld | Germany | (1943) (2003) (1983) | |||||
| Treviso / Istrana | Italy | (2013) (2003) (2022) | |||||
| Papa | Hungary | (2017) (2013) (2013) | |||||
| Melun | France | (1990) (2003) (2019) | |||||
| Bissau Aeroport | Guinea-Bissau | (2019) (1976) (1976) | |||||
| Tumbes | Peru | (1997) (1976) (2020) | |||||
| Bern / Belp | Switzerland | (2022) (2022) (2019) | |||||
| Lugano | Switzerland | (2017) (2003) (1983) | |||||
| Linz / Hoersching-Flughafen | Austria | (2013) (2011) (1983) | |||||
| Laayoune/Hassan Isl | Morocco | (2012) (1980) (1980) | |||||
| Tenerife / Los Rodeos | Spain | (2000) (1966) (2009) | |||||
| Hierro / Aeropuerto | Spain | (2023) (1976) (2012) | |||||
| S. Tome | Sao Tome and Principe | (2020) (1979) (1975) | |||||
| Neuburg / Donau | Germany | (2003) (1998) (1983) | |||||
| Ingolstadt | Germany | (1992) (2003) (1983) | |||||
| Laupheim | Germany | (2003) (2003) (2003) | |||||
| Altenstadt | Germany | (1992) (1998) (1984) | |||||
| Ramstein | Germany | (2003) (2015) (2015) | |||||
| Lahr, CAN-AFB | Germany | (2018) (2003) (2003) | |||||
| Friedrichshafen | Germany | (1986) (2003) (2003) | |||||
| Saarbruecken / Ensheim | Germany | (2022) (2022) (2019) | |||||
| Oradea | Romania | (2017) (1992) (1992) | |||||
| Troyes | France | (1986) (2003) (2019) | |||||
| Strasbourg | France | (2022) (2015) (2015) | |||||
| Luxembourg / Luxembourg | Luxembourg | (2018) (2003) (2019) | |||||
| Wien / Schwechat-Flughafen | Austria | (2013) (2013) (2012) | |||||
| Salzburg-Flughafen | Austria | (2013) (1965) (1983) | |||||
| Nyiregyhaza / Napkor | Hungary | (2012) (2012) (1978) | |||||
| Ansbach / Katterbach | Germany | (1943) (1994) (1994) | |||||
| Bratislava Ivanka | Slovakia | (2013) (2013) (2013) | |||||
| Innsbruck-Flughafen | Austria | (2013) (2003) (2019) | |||||
| Osijek / Cepin | Croatia | (1988) (2012) (2007) | |||||
| La Palma / Aeropuerto | Spain | (2004) (1976) (2015) | |||||
| Spangdahlem | Germany | (1990) (2003) (2019) | |||||
| Illesheim | Germany | (1943) (2003) (2003) | |||||
| Bierset | Belgium | (1986) (1994) (2019) | |||||
| Landivisiau | France | (2022) (2003) (2022) | |||||
| Satu Mare | Romania | (2017) (2012) (1992) | |||||
| Fernando De Noronha | Brazil | (2019) (1982) (1989) | |||||
| Graz-Thalerhof-Flughafen | Austria | (2013) (2013) (2013) | |||||
| Udine / Rivolto | Italy | (2017) (2003) (1983) | |||||
| Treviso / S. Angelo | Italy | (2003) (2003) (1989) | |||||
| Milano / Linate | Italy | (1985) (2003) (2003) | |||||
| Torino / Caselle | Italy | (2022) (1984) (1984) | |||||
| Bergamo / Orio Al Serio | Italy | (2017) (1979) (1979) | |||||
| Pecs / Pogany | Hungary | (1988) (2012) (2007) | |||||
| Budapest / Ferihegy | Hungary | (2017) (2015) (2007) | |||||
| Lyon / Bron | France | (2022) (2023) (2023) | |||||
| Noervenich | Germany | (1986) (2003) (2019) | |||||
| Geilenkirchen | Germany | (1986) (1994) (2022) | |||||
| Fritzlar | Germany | (2018) (2003) (2022) | |||||
| Dortmund / Wickede | Germany | (2018) (2003) (2019) | |||||
| Stuttgart-Echterdingen | Germany | (2018) (2003) (1941) | |||||
| Nuernberg | Germany | (1971) (2003) (1983) | |||||
| Koeln / Bonn | Germany | (2018) (2003) (2019) | |||||
| Charleroi / Gosselies | Belgium | (1986) (2003) (2019) | |||||
| Habib Bourguiba | Tunisia | (2002) (2022) (2023) | |||||
| Zurich-Kloten | Switzerland | (2018) (2003) (2003) | |||||
| Connaught | Ireland | (1938) (2003) (2018) | |||||
| Baden Wurttemberg, Neuostheim | Germany | (1986) (2015) (2019) | |||||
| Frankfurt / M-Flughafen | Germany | (1943) (2015) (2019) | |||||
| Grafenwoehr | Germany | (2018) (2015) (1983) | |||||
| Brescia / Ghedi | Italy | (2017) (1998) (1998) | |||||
| Luxeuil | France | (2018) (2003) (1983) | |||||
| Hof | Germany | (1971) (2003) (2003) | |||||
| Szolnok | Hungary | (2017) (2012) (2012) | |||||
| Nancy / Essey | France | (1986) (2003) (2019) | |||||
| Gilze-Rijen | Netherlands | (1990) (2020) (2019) | |||||
| Ascension Island | Saint Helena | (2002) (2021) (2004) | |||||
| Vlieland | Netherlands | (1999) (1997) (2018) | |||||
| Deelen | Netherlands | (2018) (2003) (2019) | |||||
| Novara / Cameri | Italy | (2017) (2003) (1984) | |||||
| Bale-Mulhouse | France | (2003) (2003) (2003) | |||||
| Paris-Charles De Gaulle | France | (1990) (2003) (2019) | |||||
| Eindhoven | Netherlands | (1990) (2009) (2019) | |||||
| St-Dizier | France | (1986) (2003) (2019) | |||||
| Lyon / Satolas | France | (2017) (2023) (2023) | |||||
| St. Gatien | France | (1990) (2003) (2019) | |||||
| Rzeszow-Jasionka | Poland | (1998) (1989) (1989) | |||||
| Volkel | Netherlands | (1990) (2003) (2019) | |||||
| Brno / Turany | Czech Republic | (2013) (2013) (2013) | |||||
| Paris-Orly | France | (1986) (2003) (2019) | |||||
| Tetuan / Sania Ramel | Morocco | (1988) (1986) (1986) | |||||
| Duesseldorf | Germany | (1986) (2012) (2019) | |||||
| Grenoble / St. Geoirs | France | (2017) (2003) (2003) | |||||
| Charlestown / Newcast | Antigua and Barbuda | (2024) (2016) (2016) | |||||
| Cockburn Town, San Salvador | Bahamas, The | (2021) (1983) (1986) | |||||
| Erzurum | Turkey | (1999) (1998) (1998) | |||||
| Porto Santo | Portugal | (2023) (1979) (1979) | |||||
| Firenze / Peretola | Italy | (2017) (2012) (2012) | |||||
| Venezia / Tessera | Italy | (2003) (1991) (1991) | |||||
| Verona / Villafranca | Italy | (2017) (2003) (2003) | |||||
| Nancy / Ochey | France | (2022) (2003) (2019) | |||||
| Dijon | France | (2018) (2003) (2019) | |||||
| Toussus Le Noble | France | (2022) (2003) (2019) | |||||
| La Heve | France | (1990) (2003) (2022) | |||||
| Chambery / Aix-Les-Bains | France | (2022) (2023) (2023) | |||||
| Gulu | Uganda | (2011) (1966) (1978) | |||||
| Tabora Airport | Tanzania | (2018) (2016) (1975) | |||||
| Sal | Cape Verde | (2020) (1974) (1979) | |||||
| Essaouira | Morocco | (2024) (2023) (2023) | |||||
| Tan-Tan | Morocco | (2000) (2023) (2023) | |||||
| Tenerife Sur | Spain | (2024) (2021) (2021) | |||||
| Sarh | Chad | (2018) (1992) (1998) | |||||
| Libreville | Gabon | (2021) (1974) (1993) | |||||
| Niederstetten | Germany | (2003) (2003) (2003) | |||||
| Leeuwarden | Netherlands | (1990) (2003) (2018) | |||||
| Maastricht Airport Zuid Limburg | Netherlands | (1986) (2003) (2019) | |||||
| Blackpool Airport | United Kingdom | (1975) (1990) (2022) | |||||
| Scilly, Saint Mary'S | United Kingdom | (1990) (2006) (2003) | |||||
| Kairouan | Tunisia | (1978) (2021) (2021) | |||||
| Lagos / Ikeja | Nigeria | (2024) (2002) (2018) | |||||
| Cotonou | Benin | (2020) (1988) (1995) | |||||
| Alert Airport | Canada | (1988) (2011) (2012) | |||||
| Meppen-Mil | Germany | (2018) (2003) (2019) | |||||
| Kassel / Calden | Germany | (2018) (2003) (2022) | |||||
| Paderborn / Lippstadt | Germany | (2018) (2003) (2003) | |||||
| Wiesbaden | Germany | (2018) (2003) (2019) | |||||
| Pisa / S. Giusto | Italy | (2017) (2011) (2005) | |||||
| St-Etienne Boutheon | France | (2022) (2023) (2015) | |||||
| Ouarzazate | Morocco | (2012) (2023) (2006) | |||||
| Tirgu Mures | Romania | (2017) (1992) (1992) | |||||
| Paris / Le Bourget | France | (1990) (2003) (2019) | |||||
| Saint-Yan | France | (2018) (2003) (2019) | |||||
| Ilheus Aeroporto | Brazil | (1984) (1993) (1995) | |||||
| Point Salines Airport | Grenada | (2024) (2009) (1998) | |||||
| Erzincan | Turkey | (2014) (2006) (1976) | |||||
| Bolzano | Italy | (2013) (2003) (1987) | |||||
| Villacoublay | France | (1990) (2003) (2019) | |||||
| Rouen | France | (1990) (2003) (2019) | |||||
| Sfax El-Maou | Tunisia | (2024) (2021) (2003) | |||||
| Bacau | Romania | (2012) (2012) (2012) | |||||
| Milano / Malpensa | Italy | (2017) (1981) (1981) | |||||
| Lille | France | (1990) (2020) (2019) | |||||
| Beauvais | France | (1990) (2003) (2019) | |||||
| Banjul / Yundum | Gambia, The | (2023) (1976) (1980) | |||||
| Abidjan | Cote d'Ivoire | (2008) (1978) (1999) | |||||
| Mildenhall Royal AFB | United Kingdom | (2018) (2003) (2022) | |||||
| . | |||||||
| Wenatchee, WA | United States | (2002) (1992) (1983) | |||||
| Herbert Island | Canada | (2019) (2008) (2002) | |||||
| St. Petersburg, FL | United States | (2001) (1999) (1998) | |||||
| Tacoma, WA | United States | (2006) (1976) (1990) | |||||
| Renton, WA | United States | (2002) (2003) (1989) | |||||
| Apartado / Los Cedros | Colombia | (1990) (2000) (1995) | |||||
| Acapulco / G. Alvarez | Mexico | (2017) (1985) (1977) | |||||
| Castlegar Airport | Canada | (1988) (1992) (1979) | |||||
| City | Country | Temp & Trend (°C) | Monthly / Alltime Record (°C) | Unofficial Daily Record (°C) | Length (years) | ||
Table Units: [ Fahrenheit | Celsius ]
| . | Tied/Broken |
Tied/Broken |
|||
| HIGH RECORD |
|||||
| LOW RECORD |
- The source of the historical data here is the NCDC GSOD (updated through 2024 as of 13 August 2025).
- The records are defined here using GMT, with the day resetting at 00GMT (7PM EST;8PM EDT).
- These records are NOT official and differ from official records that use a longer database and local (not GMT) time.
- Only cities having an NCDC GSOD recorded history of at least 35 years are shown here.
- With the additional year of data available (2024), 83 new stations (for a total of 3823) now meet the 35 year minimum record.
- In cases when there are multiple years of records for a city, the latest (most recent) year is shown above.
- Note that given the relatively short record used here (as small as 35 years), records will almost assuredly be set somewhere every day for the next several decades to centuries.
- Appreciation to R. Maue, E. Blake, and R. Remondelli, among several others, for feedback.